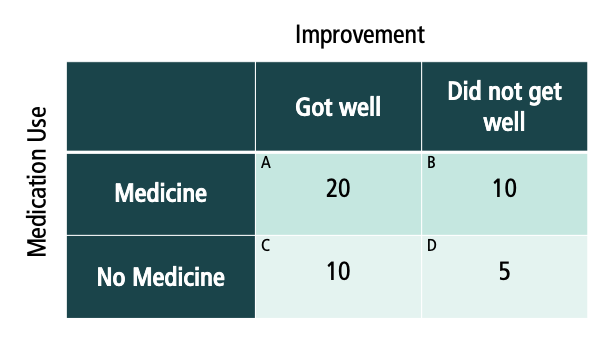
In a recent study, we investigated people’s ability to interpret bar graphs. What we found: Even college students find it difficult. On average, they solved less than 50% of the problems correctly.
For details, download our paper!
Knöchelmann, N., Krueger, S., Flack, A., & Osterhaus, C. (2019). Adults’ ability to interpret covariation data presented in bar graphs depends on the context of the problem. Frontline Learning Research, 7(4), 58 –65. doi:10.14786/flr.v7i4.471


